Home
Sports
Football
NFL
NCAAF
CFL
Basketball
NBA
NCAAB
WNBA
Baseball
MLB
Hockey
NHL
Tennis
All Tennis
Golf
All Golf
Soccer
All Soccer
MMA
All MMA
Tools
Proptimizer
Top Props
PrizePicks
Sleeper Picks
NEW
Sharp Report
Analysis
Menu
Tracker
Betting Resources
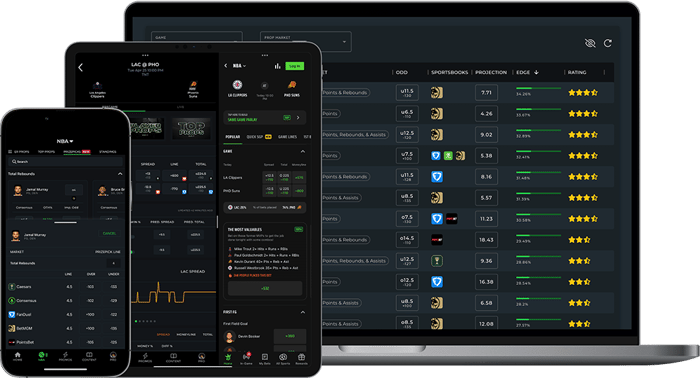
Sharp App Mobile
Sports Betting Discord
Coach Results Tracker
Feed
Academy
Pricing
Login
Sign up
Join 59,501 Bettors
Beating The Books
Register Free
Tour Sharp Pro
sharp report
THE SHARP REPORT FOR APRIL THE SHARP REPORT FOR APRIL 26, 2024, 2024
Anthony P • 10 hours ago
Latest
sharp report
THE SHARP REPORT FOR APRIL THE SHARP REPORT FOR APRIL 26, 2024, 2024
Anthony P • 10 hours ago
prizepicks
PRIZEPICKS NBA PLAYOFFS PICKS | FLEX FRIDAY 4/26/2024 | NBA PLAYER PROPS | NBA PICKS & BETS TODAY
Madness-DFS • 10 hours ago
vals big pay day parlay
Val's Big Payday Parlay April 26th 2024
Val • 11 hours ago
mlb
ANTHONY P'S MLB MODEL APRIL 26, 2024
Anthony P • 15 hours ago
nba
ANTHONY P'S NBA MODEL APRIL 26, 2024
Anthony P • 15 hours ago
mlb
MLB Bet of the Day | April 26, 2024
Mitch S • 15 hours ago
See More
Offers
State / Province
Ohio
There are no promotional offers available for the selected region.
NCAAB
ncaab
Purdue vs. UConn: A Championship Battle Tailored for Purdue to Cover and an Under on the Total
Anthony P • 19 days ago
prizepicks
PRIZEPICKS CBB PICKS | FLEX FRIDAY 3/29/2024 | SWEET 16 COLLEGE BASKETBALL PLAYER PROPS & BETS TODAY
Madness-DFS • a month ago
ncaab
Geek's March Madness Betting Challenge Round 2
Kevin "Geek" Alan • a month ago
vals big pay day parlay
Val's Big Payday Parlay March 22nd 2024
Val • a month ago
ncaab
PRIZEPICKS CBB PICKS | THURSDAY 3/21/2024 | COLLEGE BASKETBALL PLAYER PROPS & BETS TODAY
Editor • a month ago
ncaab
Maximizing March Madness: Betting Every PLUS EV Game with the Sharp Fighton Model
Anthony P • a month ago
See More
NBA
prizepicks
PRIZEPICKS NBA PLAYOFFS PICKS | FLEX FRIDAY 4/26/2024 | NBA PLAYER PROPS | NBA PICKS & BETS TODAY
Madness-DFS • 10 hours ago
nba
ANTHONY P'S NBA MODEL APRIL 26, 2024
Anthony P • 15 hours ago
prizepicks
PRIZEPICKS NBA PLAYOFFS PICKS | THURSDAY 4/25/2024 | NBA PLAYER PROPS | NBA PICKS & BETS TODAY
Madness-DFS • a day ago
nba
ANTHONY P'S NBA MODEL APRIL 25, 2024
Anthony P • 2 days ago
prizepicks
PRIZEPICKS NBA PLAYOFFS PICKS | WEDNESDAY 4/24/2024 | NBA PLAYER PROPS | NBA PICKS & BETS TODAY
Madness-DFS • 2 days ago
nba
ANTHONY P'S NBA MODEL APRIL 24 2024
Anthony P • 3 days ago
See More
NHL
vals big pay day parlay
Val's Big Payday Parlay April 25th 2024
Val • 2 days ago
nhl
ANTHONY P'S NHL MODEL APRIL 25, 2024
Anthony P • 2 days ago
nhl
ANTHONY P'S NHL MODEL APRIL 24, 2024
Anthony P • 3 days ago
vals big pay day parlay
Val's Big Payday Parlay April 23rd 2024
Val • 3 days ago
nhl
ANTHONY P'S NHL APRIL 23, 2024
Anthony P • 4 days ago
vals big pay day parlay
Val's Big Payday Parlay April 22nd
Val • 4 days ago
See More
MLB
vals big pay day parlay
Val's Big Payday Parlay April 26th 2024
Val • 11 hours ago
mlb
MLB Bet of the Day | April 26, 2024
Mitch S • 15 hours ago
mlb
ANTHONY P'S MLB MODEL APRIL 26, 2024
Anthony P • 15 hours ago
vals big pay day parlay
Val's Big Payday Parlay April 25th 2024
Val • 2 days ago
mlb
ANTHONY P'S MLB MODEL APRIL 25, 2024
Anthony P • 2 days ago
top props
MLB Top Props Strikeouts April 25, 2024
John Alesia • 2 days ago
See More
Sportsbook Reviews
Bet365 Review
BetMGM Review
BetRivers Review
Caesars Review
DraftKings Review
FanDuel Review
PointsBet Review